A Tour of AxoGraph's Main Features
Present
Symbol Settings
Each trace in a graph can be displayed with a different symbol type, line thickness or color setting. These are controlled via the 'Symbol and Line Settings' dialog.
- Settings can be applied to a single trace, to a group of traces, or to all traces in a graph
- Trace color is adjusted via the popup menu at top-right
- Turning on the 'Legend' check box adds a symbol legend to the graph window
- Symbol type and separation are selected via the 'Symbol' tab of the dialog...
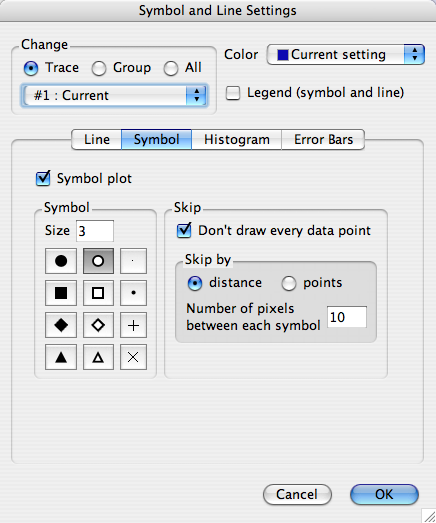
When a trace contains a large number of data points, the symbols tend to overlap creating a graph that is difficult to interpret. To avoid this problem, symbols can be drawn only for selected data points. Skipping groups of data points will improve the display of steady-state regions of a trace, but may leave a gap in rapidly changing regions. A better appearance may be achieved by drawing symbols that are separated by a specified distance (in pixels).
Line Settings
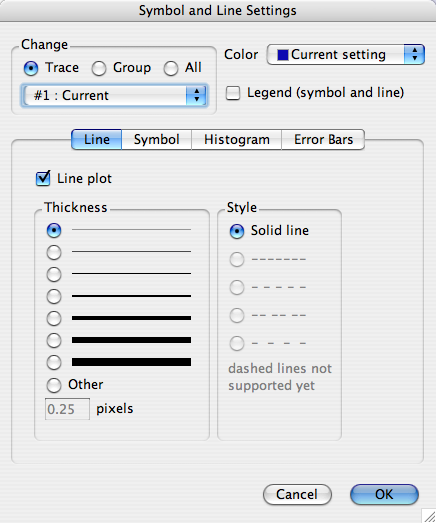
A trace can be drawn using symbols, a line, or both.
- Line thickness is controlled via the 'Line' tab of the dialog
- Default line thickness is a 0.25 pixel 'hair-line'
- Dashed line plots are not yet supported (technical limitations)
Histogram Settings
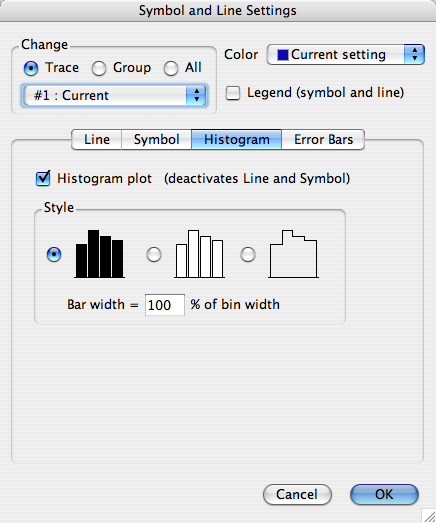
A histogram plot draws a vertical bar at each data point.
- Histogram fill type and bar width are controlled via the 'Histogram' tab of the dialog
- Default bar width is the distance between adjacent data points, so that the bars merge
- Bar width can be reduced so that each bar is drawn separately
- Bars can be solid or outlined
- 'City-scape' style draws an outline of the entire histogram
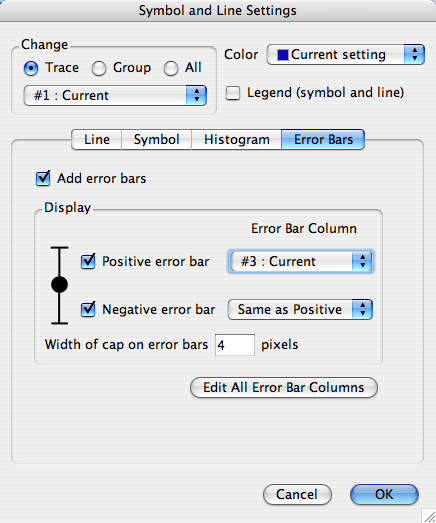
Error Bar Settings
When a data file includes columns with standard-deviation or standard-error values for each data point, error bars can be added to a trace.
- The columns containing standard-error data are specified via the 'Error Bar' tab of the dialog
- By default, positive and negative error bars are the same height
- optionally assign different columns to positive and negative error bars
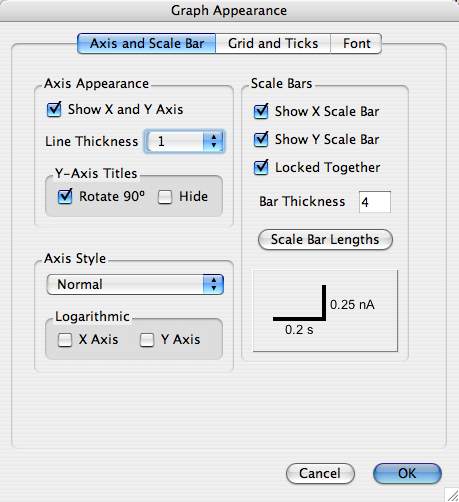
Axis, Grid and Scale Bar
A graph's scale can be depicted by X and Y axes, grid lines or scale-bars.
- Y-axis titles can be drawn vertically, or hidden to save space
- 'Normal' style axes are drawn to the left and below the traces
- Axes can also be drawn crossing at the origin (0,0)
- Logarithmic axes and grids are supported
- When scale bars are present, they can be dragged into position in the graph window
- X and Y scale bars can be positioned independently, or locked together
- These parameters are set via the 'Axis and Scale Bar' tab of the dialog...
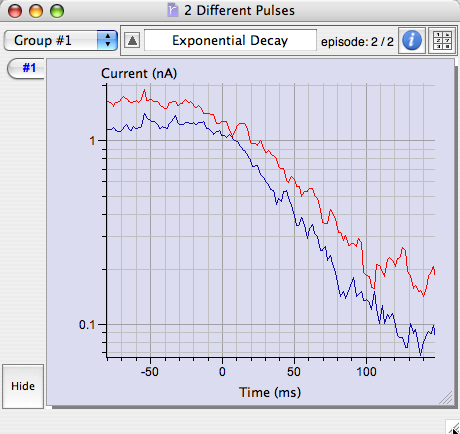
- Grid lines can assist rapid visual assessment of graph features
- They are drawn at the same position as tick marks on X and Y axes
- Grid lines are activated via the 'Grid and Ticks' tab of the dialog (not shown)
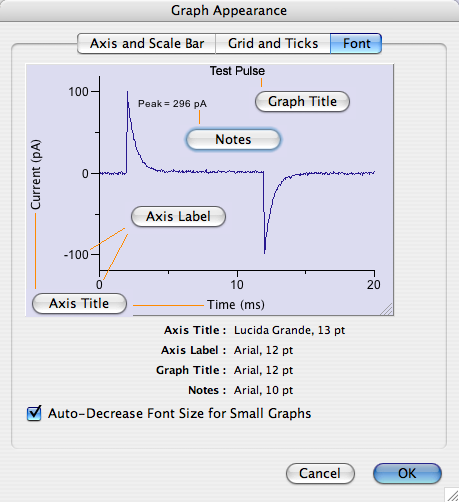
- The font and size of various text elements in a graph are specified via the 'Font' tab...
Graph Background Color
The default color of many graph features, including the graph background, can be set via the main AxoGraph preferences dialog.
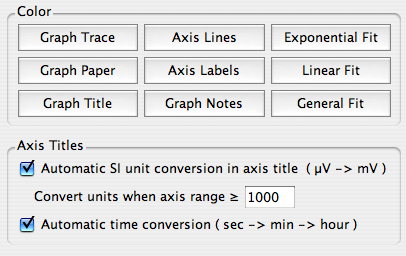
By default, axis units are optimized for display. For example if the axis units are set to Volts and an axis range of 0 to 0.1 V is selected, AxoGraph will display the axis as 0 to 100 mV. Time units get special handling with a large axis range in seconds being converted to minutes or hours. This automatic unit conversion can be switched off via the main preferences dialog.
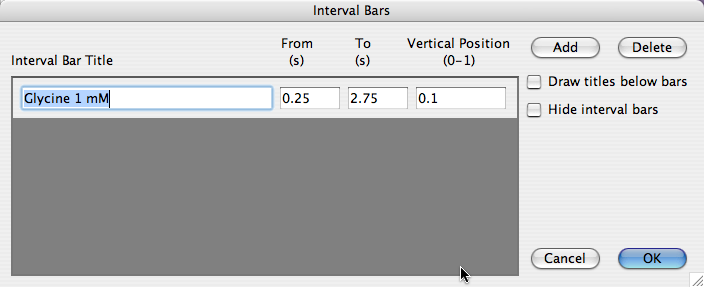
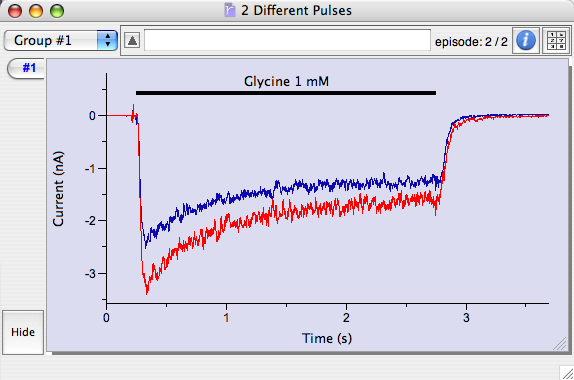
Interval Bars
Interval bars are typically used when preparing a graph for presentation or publication. They can indicate the period during which an experimental condition was applied (for example, drug application or light exposure).
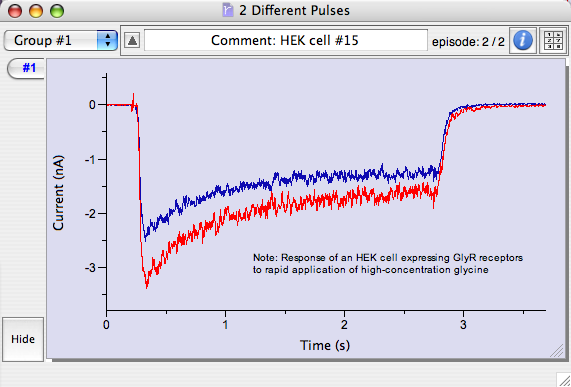
Comment and Note
A single line comment can be added to the title bar of a graph. The comment is always visible. A multi-line note can also be added to a graph. It can be dragged to any position in the graph window, or it can be hidden.